
Mallorca Climate Table: All Weather Data Year-Round
Palma normals as an island-wide approximation: In September, the average daytime high is 27 °C and the sea is 24.7 °C, with 4 rain days and 7.9 hours of sunshine per day.
Anyone planning a trip to Mallorca or considering a move wants to know what to expect, and in which month. The climate table for Mallorca provides reliable guidance here: air temperature, water temperature, rainfall, hours of sunshine and other figures for every month of the year, recorded at the Palma station over many years of observation. This article explains how to read the table, what the individual figures mean in everyday life, which particular features shape Mallorca's climate, and where the limits of this data series lie.
Climate table: Mallorca's year at a glance
The climate table brings together Mallorca's key weather data in twelve monthly columns: daytime high temperature, daytime low temperature, monthly mean temperature, water temperature, rainfall amount, number of rainy days, daily hours of sunshine, relative humidity, average wind speed and the length of daylight. It is supplemented by annual figures such as total hours of sunshine, rainy days per year, annual rainfall, and two different temperature averages. The figures are based on the Palma weather station, which serves as the reference point for the island because it has the longest and most continuous measurement record. The values relate to a multi-year normal period, that is, an average over a long span of time that evens out individual unusual years and gives a realistic picture of typical weather, rather than the weather of any particular year.
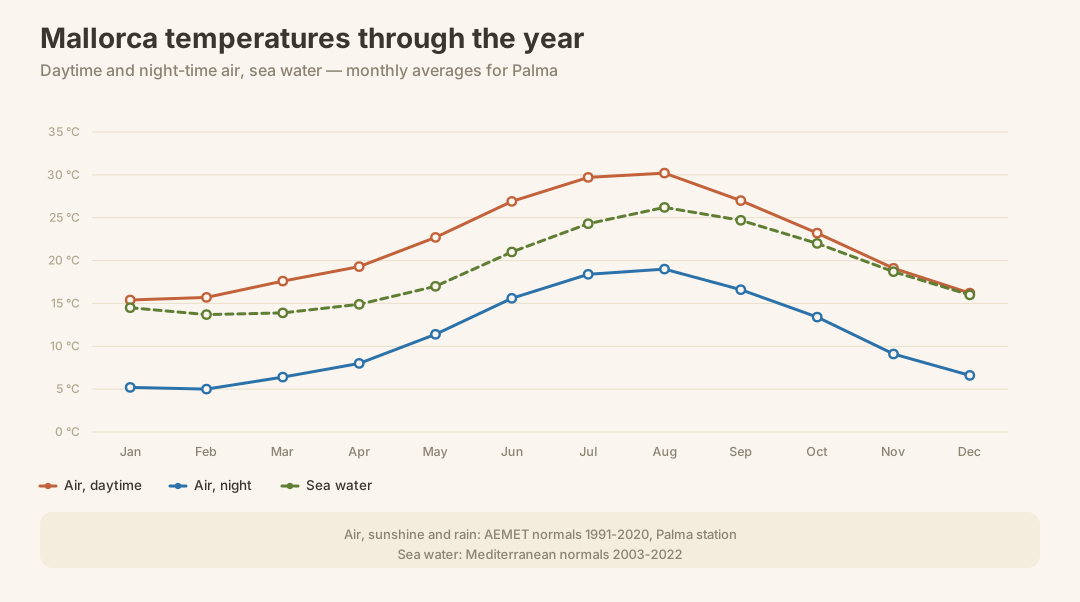
When reading the table, it is worth looking closely at the three temperature columns, since they describe different things. The daytime high is the value reached on an average day of the given month in the afternoon, the warmest moment of the day. The daytime low, by contrast, is the coolest value, usually measured shortly before sunrise. The monthly mean lies between the two and represents the average across the whole day-and-night cycle, describing how warm it is on average over the entire day, not just at the warmest time of day. In July, for instance, the daytime high stands at 29.7 °C, while the monthly mean, at 24.0 °C, remains noticeably lower.
This is exactly where the most common mistake in climate comparisons arises: if you average the daily highs across the whole year, you get a figure noticeably above the true annual mean temperature, because it only takes into account the warmest moment of each day and leaves out the cooler night and morning hours. This becomes clear at the annual level: the true annual mean temperature is 16.6 °C, while the average of the daily highs, at 21.9 °C, sits several degrees above it. Anyone promoting a destination using this higher figure and presenting it as the annual average temperature is making an unfair comparison against places correctly quoted with the true mean. On mallorca.com, we therefore show both figures separately, so you know exactly which of the two you are looking at.
| Month | Day | Night | Sea | Sun/day | Rainy days | Rain | Humidity |
|---|---|---|---|---|---|---|---|
| January | 15.4 °C | 5.2 °C | 14.5 °C | 5.5 h | 6 | 43 mm | 76 % |
| February | 15.7 °C | 5.0 °C | 13.7 °C | 6.1 h | 5 | 32 mm | 74 % |
| March | 17.6 °C | 6.4 °C | 13.9 °C | 6.7 h | 5 | 28 mm | 71 % |
| April | 19.3 °C | 8.0 °C | 14.9 °C | 7.3 h | 6 | 39 mm | 70 % |
| May | 22.7 °C | 11.4 °C | 17.0 °C | 9.4 h | 4 | 30 mm | 68 % |
| June | 26.9 °C | 15.6 °C | 21.0 °C | 10.4 h | 2 | 16 mm | 64 % |
| July | 29.7 °C | 18.4 °C | 24.3 °C | 11.1 h | 1 | 7 mm | 63 % |
| August | 30.2 °C | 19.0 °C | 26.2 °C | 10.3 h | 2 | 21 mm | 65 % |
| September | 27.0 °C | 16.6 °C | 24.7 °C | 7.9 h | 4 | 51 mm | 70 % |
| October | 23.2 °C | 13.4 °C | 22.0 °C | 6.4 h | 7 | 67 mm | 74 % |
| November | 19.1 °C | 9.1 °C | 18.7 °C | 5.4 h | 6 | 51 mm | 76 % |
| December | 16.2 °C | 6.6 °C | 16.0 °C | 4.9 h | 6 | 53 mm | 76 % |
What the figures mean in everyday life
Figures only become useful once you translate them into experience. Swimming usually only feels truly pleasant once the water temperature reaches a level you no longer perceive as cool. In June the sea sits at 21.0 °C; it turns properly warm at the height of summer, when August marks its peak at 26.2 °C. Anyone wanting to swim as early as May should expect 17.0 °C, noticeably fresher than in summer, but for many still perfectly bearable.
For hikes in the Serra de Tramuntana or long walks, what matters is less the water temperature than the daytime high of the air. In July and August, when the daytime highs reach 29.7 °C and 30.2 °C respectively, walking for any length of time in the midday sun becomes strenuous, especially on stony, shadeless paths. Anyone wanting to hike during this period is better off sticking to the early morning hours, or shifting more demanding routes to months such as April or October, when the highs stand at 19.3 °C and 23.2 °C respectively and the air remains milder overall.
In the evenings, even in summer, it can turn cooler than you might expect during the day, particularly away from the coastal towns or when the wind picks up. In winter a jacket becomes almost essential: the daytime lows drop to 5.2 °C in January, and anyone out in the evening will feel the chill clearly, even though the daytime highs, at 15.4 °C, still seem mild. In the transitional months of March and November, it is worth checking the lows before heading out without a jacket.
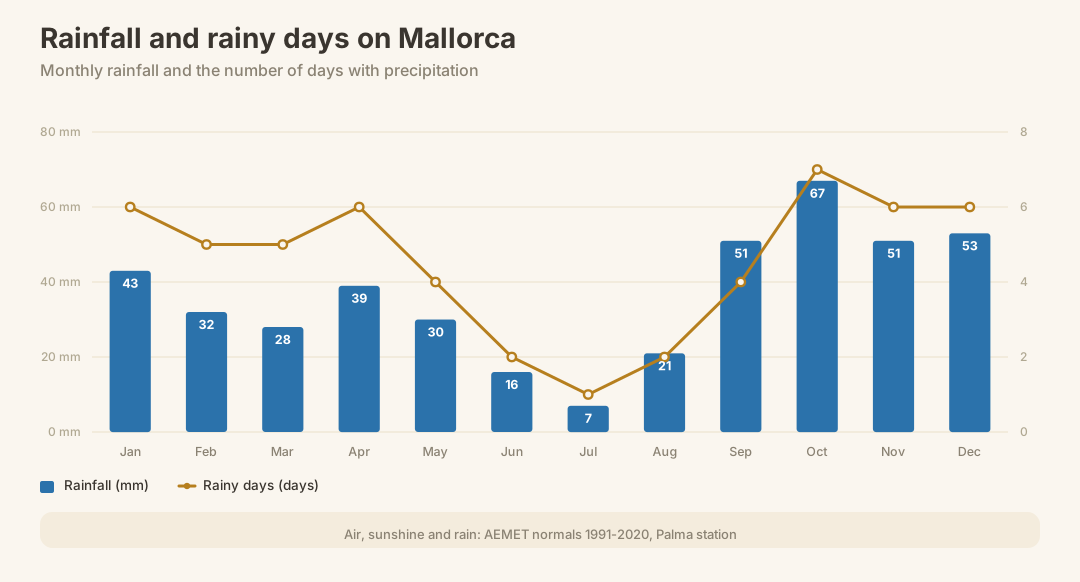
Rain is never the dominant theme in Mallorca, but it is distributed very unevenly across the year. At the height of summer, in July for example, hardly any rain falls; the island records just 1 rainy day that month, so rain plays practically no role in holiday planning. Autumn is different: October brings considerably more rainfall, at 67 mm, spread across 7 rainy days, often in the form of heavy but brief showers or thunderstorms that usually leave the rest of the day unaffected.
Distinctive features of Mallorca's climate
Mallorca's climate differs noticeably in several respects from what is familiar from the Spanish or French Mediterranean mainland, and the reason lies above all in its location out in the sea. Water warms up far more slowly than land, but it also retains the heat it absorbs for much longer. This physical inertia means that the sea around the island warms only reluctantly in spring, even once the air on land has already become noticeably warmer. That is why swimming often still feels cool in spring, even though the sun is already shining strongly. In autumn the effect reverses: the sea has stored so much heat over the summer that it continues releasing it well into October and, in part, into November, while the air is already cooling noticeably. This lag of several weeks between air temperature and water temperature is one of the most defining effects of the island's climate.
A second distinctive feature lies in the island's own relief. The Serra de Tramuntana in the north-west acts as a weather divide between one coast and the other. Moist air masses moving in from the north-west are forced to rise on the mountains' steep slopes, cooling as they do so and releasing their rain there, before they ever reach the south-eastern parts of the island. This explains why the north-west coast around Sóller, or the mountains themselves, receive noticeably more rainfall than the plain around Palma or the east of the island, even though both regions lie only a few kilometres apart as the crow flies.
In winter, this mountainous setting makes itself felt in another way too: through the Tramuntana, a cold and often powerful downslope wind that streams down over the mountains from the north. It arises when cold air builds up over mainland Europe and flows southward across the Mediterranean, being further accelerated as it is funnelled between the Pyrenees and the Alps, before finally striking the Balearics with considerable force. On days with a Tramuntana, temperatures can feel noticeably colder than the thermometer suggests, and ferry crossings as well as flights can also be affected.
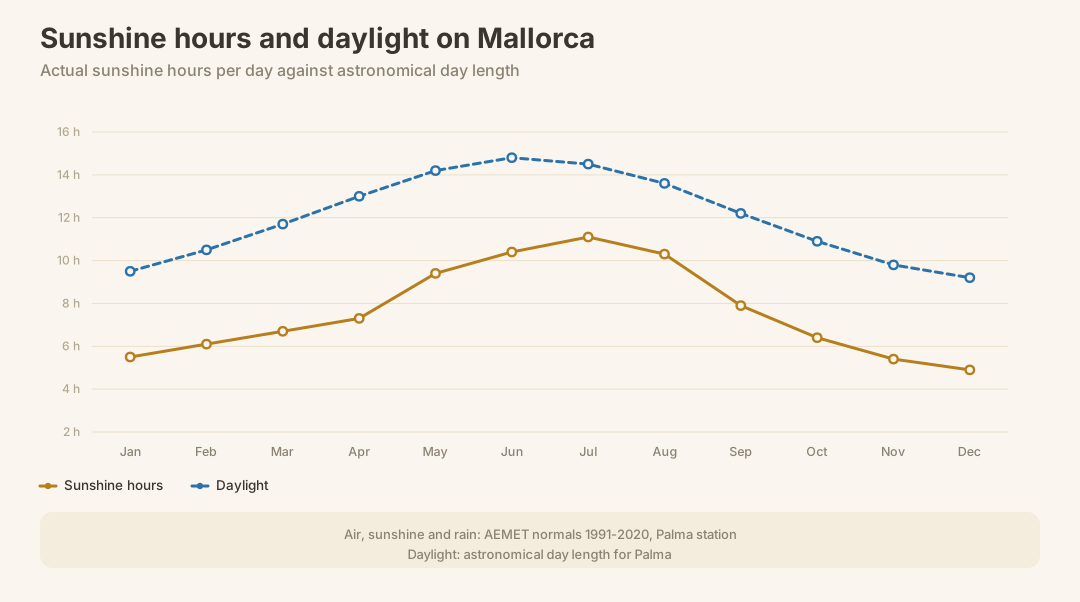
The height of summer, in turn, is marked by a pronounced dryness, which stems from the large-scale high-pressure system that settles over the western Mediterranean at this time of year and reliably keeps rain clouds away. This stable weather pattern produces the long, dependably sunny days for which the island is known, but it also leaves soil and vegetation without any significant rainfall for weeks on end.
Seasonal weather patterns
Winter in Mallorca is mild compared with central Europe, but not warm in the Mediterranean sense of high summer. Daytime highs in January hover around 15.4 °C, nights cool down to 5.2 °C, and the occasional Tramuntana wind can make it feel colder than the figures suggest. Rain falls more regularly in this season than in summer, though rarely for days on end; December records 6 rainy days, mostly spread across shorter showers.
In spring, temperatures rise only slowly at first. The air warms up noticeably from month to month; by April the highs already reach 19.3 °C, but the sea lags behind: at 14.9 °C, the water remains distinctly cooler than the mild air would suggest. This lag between land and sea is a constant feature of the island's climate and explains why a sunny spring day is not automatically a good day for swimming.
Summer brings the highest temperatures and the lowest rainfall of the year. July and August lie close together with highs of 29.7 °C and 30.2 °C, and both months rank among the driest of all, with July recording just 1 rainy day. The sea has by then already caught up considerably, reaching 24.3 °C in July, though it only reaches its true peak with some delay.
It is precisely this delay that makes autumn one of the most interesting seasons for anyone who loves the sea. While the air in October, at 23.2 °C, is already noticeably cooler than at the height of summer, the water temperature, at 22.0 °C, still holds at a level above that of June, when the sea reaches only 21.0 °C. So anyone deciding purely by water temperature is better served in October than in June, even though the air feels warmer in early summer and the days are longer. Autumn overall unfolds gently: the warmth lingers for longer than it took to build up in spring, and it is only towards November that things cool down noticeably, while rainfall picks up again at the same time, ushering in the transition to winter.
How the measurements are obtained
The figures in this climate table do not come from a single year, but from what is known as a normal period: an average taken over a long span, usually thirty years. Thirty years is considered in climatology to be long enough to smooth out individual years that were particularly warm, cold, dry or wet, without being so long that any genuine climate change disappears within the data. The result is a robust picture of typical weather for each month, not a forecast for any particular year, nor a snapshot of a single summer.
These figures are measured at the Palma station, which stands for the plain in the south and south-west of the island: the region around the Bay of Palma, the airport, and the densely populated surrounding area. This location makes the station representative of a large part of the island, where most people live and most visitors spend their time. It is, however, explicitly not representative of Mallorca as a whole. In the Serra de Tramuntana, for instance around Sóller or at higher altitudes in the mountains, different conditions prevail: more rainfall, cooler nights, and a noticeably different character of weather altogether. The north coast around Formentor or Pollença also differs in its wind and rainfall behaviour from the more sheltered Bay of Palma.
Anyone wanting to know how the climate presents itself in these differing regions of the island will find the relevant differences on our page about Mallorca's climate zones. This climate table deliberately reflects the island-wide average via the reference station in Palma and makes no claim to capture every microclimate of the island in detail.
Sea temperature month by month
- Sea temperature in January
- Sea temperature in February
- Sea temperature in March
- Sea temperature in April
- Sea temperature in May
- Sea temperature in June
- Sea temperature in July
- Sea temperature in August
- Sea temperature in September
- Sea temperature in October
- Sea temperature in November
- Sea temperature in December
The weather month by month
- Weather in January
- Weather in February
- Weather in March
- Weather in April
- Weather in May
- Weather in June
- Weather in July
- Weather in August
- Weather in September
- Weather in October
- Weather in November
- Weather in December
Frequently asked questions
How do I read a climate table for Mallorca?
Which month is the warmest according to Mallorca's climate table?
Which month has the most rain in Mallorca's climate table?
Why do air and sea temperatures differ so much in the table?
How can I use the climate table to plan my trip to Mallorca?
What's on in Mallorca in September
- Day Ø 21.8 °C
- Sea 24.7 °C
- Rain days 4
- Sun 7.9 h
- Daylight 12.2 h
Events
- Languages of Colours · Storytelling to celebrate linguistic diversity in EuropeValldemossa
- Workers Party (Reggaeton)Calvià
- SEO Congress - Sociedad Española de OftalmologíaPalma
- Workers Party (Reggaeton)Calvià
- Opening of “Conexión”Capdepera
- Sustainable Mobility DayCapdepera
Worth doing now
- Cross-check the table against your priorities, whether that's beach weather, hiking conditions or lower prices.
- Use the driest months for sightseeing trips and the warmest sea months for a beach-focused stay.